
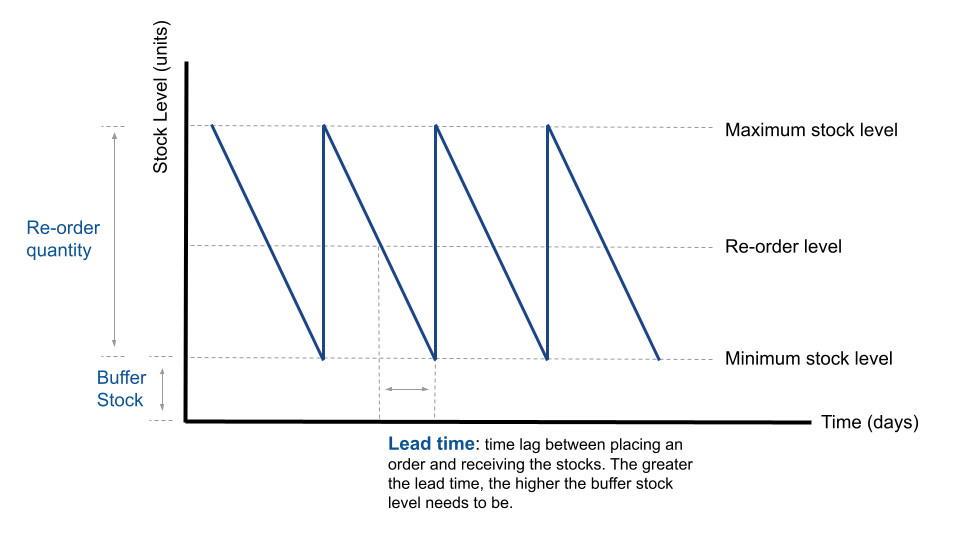
Stock Control Chart
Stock control charts for the most part all look the same, like a break=even chart all you have to do is memorize what the chart looks like and fill in the corresponding values according to the values found within the case study. Memorize the chart below and know HOW and WHY each function represents what it represents.
Stock Control Chart Practice Question
